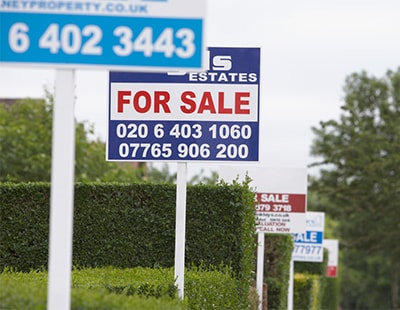
A study by estate agent comparison site GetAgent.co.uk has found that the average homeowner in England and Wales achieved 98% of asking price in 2021, a significant increase from 96% in 2020.
GetAgent pulled data from all of the major property listing portals which are then cross-referenced with the Land Registry using their proprietary algorithms and input from partner agents, to find where sellers have achieved the best price for their property compared to the price they listed it for sale at.
Strongest home seller hotspots
GetAgent’s data found that the average home seller listed their property at an asking price of £326,212 in 2021, while they achieved £319,119 or 98% when it came to actually selling.
In total, 157 postcodes across England and Wales saw home sellers achieve 100% of asking price or higher in 2021.
The best performing of the lot was the TS2 postcode in Middlesbrough, where home sellers achieved 117% of asking price. In second place is Gwynedd’s LL45 postcode they achieved 114% of asking price, with home sellers in NE69 in Northumberland achieving 112% of the original asking price.
These three postcodes have also seen the largest year on year increase in the percentage of asking price achieved, up 18% in LL45, 17% in TS2 and 13% in NE69.
Worst performing postcodes
Camden’s WC1R postcode has been the worst performer of the market in 2021 where the percentage of asking price achieved is concerned. While home sellers listed at an average of £959,337, they achieved £767,470 - just 80% of their original asking price.
The postcode has also seen the largest year on year decline, with home sellers achieving 95% of asking price in 2020, 15% more than 2021.
Westminster’s W1D postcode also saw home sellers achieve just 80% of asking price in 2021, while Bradford’s BD1 postcode is the only area outside of the capital to make the top 10 when it comes to the lowest level of asking price achieved in 2021 (85%).
Founder and chief executive officer of GetAgent.co.uk, Colby Short, commented: “2021 brought another incredibly strong year for the housing market and the nation’s home sellers.”
“The extension of the stamp duty holiday, as well as the continued low cost of borrowing, ensured that the percentage of asking price they were able to achieve continued to climb on the impressive performance posted in 2020.”
Short concluded: “Of course, not everyone has benefitted to the same extent and we’ve seen the London market trail quite considerably behind the rest of the UK, with the capital accounting for nine out of 10 of the worst performing postcodes across the nation.”
|
Table shows the postcodes where the highest percentage of asking price was achieved in 2021
|
|
Outcode
|
Location
|
Average asking price 2021
|
Average price achieved 2021
|
Percent Asking Price % 2021
|
|
TS2
|
Middlesbrough
|
£39,955
|
£46,622
|
117%
|
|
LL45
|
Gwynedd
|
£460,311
|
£526,070
|
114%
|
|
NE69
|
Northumberland
|
£637,076
|
£714,298
|
112%
|
|
S8
|
Sheffield
|
£234,462
|
£245,886
|
105%
|
|
LL69
|
Anglesey
|
£250,136
|
£261,558
|
105%
|
|
S11
|
Sheffield
|
£345,589
|
£360,122
|
104%
|
|
L28
|
Liverpool
|
£105,456
|
£109,776
|
104%
|
|
S17
|
Sheffield
|
£423,960
|
£440,201
|
104%
|
|
S14
|
Sheffield
|
£112,458
|
£116,318
|
103%
|
|
SA42
|
Pembrokeshire
|
£408,528
|
£422,531
|
103%
|
|
England and Wales
|
£326,212
|
£319,119
|
98%
|
|
Table shows the postcodes with the largest annual increase in the percentage of asking price achieved
|
|
Outcode
|
Location
|
Percent Asking Price % 2020
|
Percent Asking Price % 2021
|
Percent Asking Price 2020 vs 2021
|
|
LL45
|
Gwynedd
|
96%
|
114%
|
18%
|
|
TS2
|
Middlesbrough
|
100%
|
117%
|
17%
|
|
NE69
|
Northumberland
|
99%
|
112%
|
13%
|
|
SA42
|
Pembrokeshire
|
91%
|
103%
|
12%
|
|
W1J
|
Westminster
|
89%
|
101%
|
12%
|
|
LL69
|
Anglesey
|
94%
|
105%
|
11%
|
|
CA9
|
Eden
|
93%
|
101%
|
8%
|
|
SA35
|
Pembrokeshire
|
92%
|
100%
|
8%
|
|
HU20
|
East Riding of Yorkshire
|
91%
|
100%
|
8%
|
|
TA15
|
Somerset
|
94%
|
102%
|
8%
|
|
England and Wales
|
96%
|
98%
|
1%
|
|
Table shows the postcodes where the lowest percentage of asking price was achieved in 2021
|
|
Outcode
|
Location
|
Average asking price 2021
|
Average price achieved 2021
|
Percent Asking Price % 2021
|
|
WC1R
|
Camden
|
£959,337
|
£767,470
|
80%
|
|
W1D
|
Westminster
|
£1,597,081
|
£1,284,803
|
80%
|
|
WC1B
|
Camden
|
£1,104,671
|
£907,169
|
82%
|
|
BD1
|
Bradford
|
£72,841
|
£61,568
|
85%
|
|
EC4V
|
City of London
|
£1,195,683
|
£1,017,250
|
85%
|
|
EC4Y
|
City of London
|
£908,855
|
£775,165
|
85%
|
|
WC2N
|
Westminster
|
£1,535,831
|
£1,322,796
|
86%
|
|
WC1N
|
Camden
|
£1,225,990
|
£1,056,218
|
86%
|
|
EC4A
|
City of London
|
£950,241
|
£820,662
|
86%
|
|
WC2E
|
Westminster
|
£2,181,560
|
£1,916,328
|
88%
|
|
England and Wales
|
£326,212
|
£319,119
|
98%
|
|
Table shows the postcodes with the largest annual decline in the percentage of asking price achieved
|
|
Outcode
|
Location
|
Percent Asking Price % 2020
|
Percent Asking Price % 2021
|
Percent Asking Price 2020 vs 2021
|
|
WC1R
|
Camden
|
95%
|
80%
|
-15%
|
|
WC1B
|
Camden
|
96%
|
82%
|
-14%
|
|
N1C
|
Camden
|
109%
|
97%
|
-12%
|
|
BD1
|
Bradford
|
94%
|
85%
|
-10%
|
|
WC1N
|
Camden
|
94%
|
86%
|
-8%
|
|
WC2E
|
Westminster
|
95%
|
88%
|
-7%
|
|
HU1
|
Kingston upon Hull
|
97%
|
90%
|
-7%
|
|
EC3N
|
Tower Hamlets
|
98%
|
92%
|
-6%
|
|
LS2
|
Leeds
|
102%
|
96%
|
-6%
|
|
CA18
|
Copeland
|
97%
|
92%
|
-5%
|
|
England and Wales
|
96%
|
98%
|
1%
|









Join the conversation
Be the first to comment (please use the comment box below)
Please login to comment