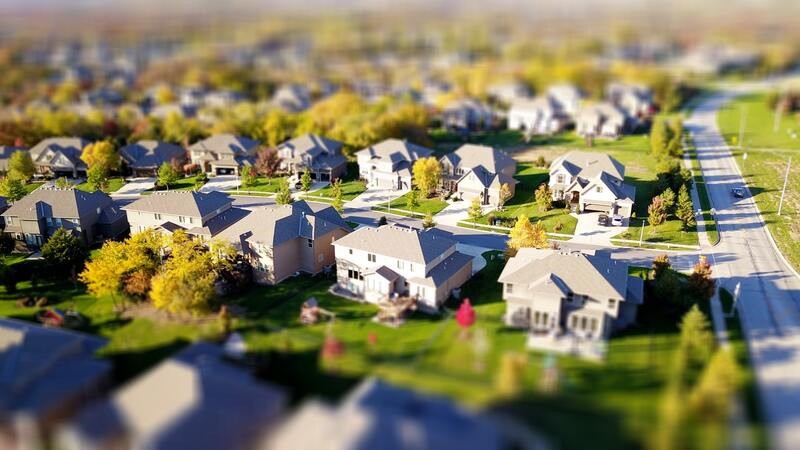
A recent study by Unlatch, the new homes sales progression and aftercare platform for developers and households, has disclosed which local authorities have seen the highest level of house building when it comes to residential development as a percentage of total space available.
The research looked at each area of England based on the total land area in hectares and what percentage of this land area has been attributed to development use for residential properties.
Developments across the nation
The nation’s grand total land area is estimated to cover almost 13.3 million hectares and only 152,380 hectares of this land is also estimated to have been used for developed residential purposes, thus equating to just 1.1% of total land area.
In the majority of regions this land usage for residential development remains fairly consistent with the national average and the South West has claimed the lowest level at 0.7%. Outside of London, the North West and South East have performed the best at 1.4%, however in the capital itself, this climbs to 10.1%.
With no surprise, the capital’s boroughs account for the most built-up property markets in the nation. In Kensington and Chelsea, 22.3% of the borough’s total land area has been used for residential development.
Islington isn’t too far behind, where a fifth of the borough has been developed for residential homes, while Lambeth (18.2%), Hackney (17.6%), and Hammersmith and Fulham (17.4%) also rank amongst the highest.
Just outside of London, Luton is the most developed local authority with respect to residential properties, accounting for 10.1% of the total land area, followed by Leicester (10%), Blackpool (9.8%), Watford (9.8%, and Worthing (9.6%)
Which areas need a bit of work?
Eden, where land developed for residential use sits low at just 268 hectares, 0.1% of the area’s total land area.
At 0.2%, Ryedale, Richmondshire, Craven, West Devon and Northumberland are also some of the least developed areas where residential property is concerned.
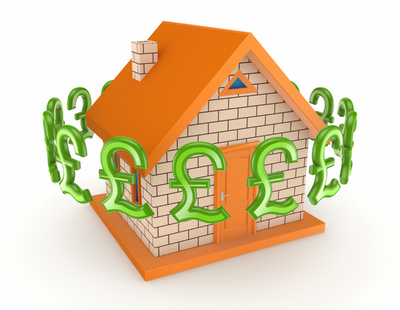
Lee Martin, head of UK for Unlatch says: “There seems to be a common misconception amongst the public that the nation is bursting at the seams when it comes to the number of homes already built and that we simply have no available land left to address the current housing crisis.”
“This simply isn’t the case, and, in fact, land utilised for residential development currently accounts for just over one per cent of the nation’s total land area. Of course, in major urban areas, this percentage is far higher, particularly in London, where the demand for housing is greater due to a larger population.”
Martin concluded: “However, in some areas, residential development accounts for a tiny fraction of total land available and it’s ironically in these areas where current homeowners are often most passionately against the construction of new homes.”
| Table shows land use for residential development and the percentage of total land this accounts for |
| |
|
Location |
Developed use - residential (hectares) |
Grand total land area (hectares) |
Proportion % - resi |
| |
|
London |
16,078 |
159,462 |
10.1% |
| |
|
North West |
20,371 |
1,485,416 |
1.4% |
| |
|
South East |
26,406 |
1,934,530 |
1.4% |
| |
|
West Midlands Region |
16,133 |
1,300,313 |
1.2% |
| |
|
Yorkshire and The Humber |
14,969 |
1,555,162 |
1.0% |
| |
|
East of England |
18,364 |
1,953,590 |
0.9% |
| |
|
North East |
7,891 |
867,398 |
0.9% |
| |
|
East Midlands |
14,196 |
1,580,851 |
0.9% |
| |
|
South West |
17,974 |
2,420,712 |
0.7% |
| |
|
England |
152,380 |
13,257,434 |
1.1% |
| |
|
|
|
|
|
| |
|
Table shows the areas with the highest level of land used for residential development as a percentage of total land area |
| |
|
Location |
Developed use - residential (hectares) |
Grand total land area (hectares) |
Proportion % - resi |
| |
|
Kensington and Chelsea |
276 |
1,238 |
22.3% |
| |
|
Islington |
299 |
1,486 |
20.1% |
| |
|
Lambeth |
495 |
2,724 |
18.2% |
| |
|
Hackney |
334 |
1,905 |
17.6% |
| |
|
Hammersmith and Fulham |
298 |
1,715 |
17.4% |
| |
|
City of Westminster |
371 |
2,203 |
16.8% |
| |
|
Wandsworth |
556 |
3,522 |
15.8% |
| |
|
Camden |
336 |
2,179 |
15.4% |
| |
|
Haringey |
455 |
2,959 |
15.4% |
| |
|
Lewisham |
504 |
3,532 |
14.3% |
| |
|
Southwark |
422 |
2,991 |
14.1% |
| |
|
Tower Hamlets |
291 |
2,157 |
13.5% |
| |
|
Brent |
568 |
4,323 |
13.1% |
| |
|
Waltham Forest |
489 |
3,879 |
12.6% |
| |
|
Newham |
456 |
3,858 |
11.8% |
| |
|
|
|
|
|
| |
|
Table shows the areas with the highest level of land used for residential development as a percentage of total land area - EXCLUDING LONDON |
| |
|
Location |
Developed use - residential (hectares) |
Grand total land area (hectares) |
Proportion % - resi |
| |
|
Luton |
437 |
4,335 |
10.1% |
| |
|
Leicester |
731 |
7,334 |
10.0% |
| |
|
Blackpool |
397 |
4,037 |
9.8% |
| |
|
Watford |
209 |
2,143 |
9.8% |
| |
|
Worthing |
323 |
3,378 |
9.6% |
| |
|
Southampton |
515 |
5,486 |
9.4% |
| |
|
Wolverhampton |
651 |
6,944 |
9.4% |
| |
|
Reading |
370 |
4,040 |
9.2% |
| |
|
City of Nottingham |
680 |
7,461 |
9.1% |
| |
|
Birmingham |
2,438 |
26,776 |
9.1% |
| |
|
Liverpool |
1,181 |
13,353 |
8.8% |
| |
|
Dudley |
855 |
9,796 |
8.7% |
| |
|
Manchester |
1,006 |
11,565 |
8.7% |
| |
|
City of Bristol |
1,015 |
11,782 |
8.6% |
| |
|
Norwich |
346 |
4,055 |
8.5% |
| |
|
|
|
|
|
| |
|
Table shows the areas with the highest level of land used for residential development as a percentage of total land area |
| |
|
Location |
Developed use - residential (hectares) |
Grand total land area (hectares) |
Proportion % - resi |
| |
|
Eden |
268 |
215,647 |
0.1% |
| |
|
Ryedale |
227 |
150,656 |
0.2% |
| |
|
Richmondshire |
209 |
131,863 |
0.2% |
| |
|
Craven |
213 |
117,873 |
0.2% |
| |
|
West Devon |
226 |
116,343 |
0.2% |
| |
|
Northumberland |
1,220 |
507,736 |
0.2% |
| |
|
South Lakeland |
466 |
171,798 |
0.3% |
| |
|
Hambleton |
365 |
131,121 |
0.3% |
| |
|
Allerdale |
375 |
132,055 |
0.3% |
| |
|
Torridge |
285 |
99,531 |
0.3% |
| |
|
Cotswold |
359 |
116,451 |
0.3% |
| |
|
East Lindsey |
569 |
183,059 |
0.3% |
| |
|
Copeland |
242 |
77,563 |
0.3% |
| |
|
West Lindsey |
363 |
115,756 |
0.3% |
| |
|
Herefordshire |
720 |
217,966 |
0.3% |


Join the conversation
Be the first to comment (please use the comment box below)
Please login to comment