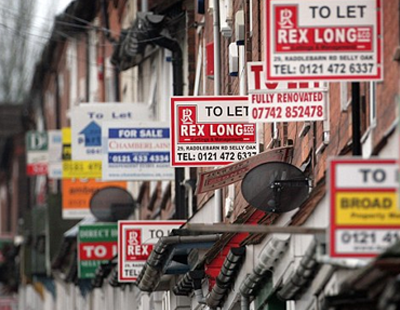
Online Mortgage Advisor has conducted a research by looking at how much property prices have outgrown local wages during the past 10 years.
It has calculated the ratio change between the median house price and median annual salary in 2013 vs December 2022 in 330 local authorities across Britain.
A higher ratio indicates a larger growth in the gap between property prices and local earnings, meaning workers were priced out of the area at the fastest rate.
The study revealed that Epsom and Ewell was the local authority where workers were priced out the most: 10 years ago, full-time workers in this area could typically expect to spend 11.55 times their annual salary on buying a home. This has risen over the years and by December 2022, workers could expect to fork out 20.54 times their salary, an increase in the ratio of 8.99.
London local authorities as well as the East and the South East of England dominate the list of the locations that have become more unaffordable compared to average salaries in the past 10 years. Kensington and Chelsea, Watford and Hillingdon come as second, third and fourth in the list as the worst affected locations.
House prices in Angus, Scotland, have seen the smallest change in the affordability radio across the country. Only in 20 local authorities buying property has become more affordable. Ten of them are located in Scotland and the rest in the North West and East of England.
| |
|
Median Salary (GBP)
|
|
Median House Price (GBP)
|
|
Property Price to Salary Ratio
|
|
Ratio Difference 2013 to 2022
|
|
Local authority
|
|
2013
|
2022
|
2013
|
2022
|
2013
|
2022
|
|
|
Epsom and Ewell
|
South East England
|
28,305
|
28,000
|
327,000
|
575,000
|
11.55
|
20.54
|
8.99
|
|
Kensington and Chelsea
|
London
|
31,307
|
34,468
|
979,000
|
1,390,000
|
31.27
|
38.12
|
6.85
|
|
Watford
|
East England
|
29,391
|
28,651
|
235,000
|
420,000
|
8.00
|
14.66
|
6.66
|
|
Hillingdon
|
London
|
35,738
|
34,271
|
269,950
|
485,000
|
7.55
|
14.15
|
6.60
|
|
Elmbridge
|
South East England
|
32,295
|
34,927
|
430,000
|
685,000
|
13.31
|
19.61
|
6.30
|
|
Barking and Dagenham
|
London
|
32,248
|
31,675
|
180,995
|
375,000
|
5.61
|
11.84
|
6.23
|
|
Barnet
|
London
|
29,953
|
34,291
|
345,000
|
612,500
|
11.75
|
17.86
|
6.11
|
|
Redbridge
|
London
|
31,215
|
34,277
|
274,998
|
496,000
|
8.81
|
14.47
|
5.66
|
|
Reigate and Banstead
|
South East England
|
30,903
|
32,276
|
290,500
|
485,000
|
9.40
|
14.98
|
5.58
|
|
Havering
|
London
|
29,858
|
33,480
|
232,500
|
445,000
|
7.79
|
13.29
|
5.50
|
|
Richmond upon Thames
|
London
|
31,997
|
37,041
|
475,000
|
752,000
|
14.85
|
20.30
|
5.45
|
|
Merton
|
London
|
28,610
|
33,702
|
320,500
|
560,000
|
11.20
|
16.62
|
5.42
|
|
Basildon
|
East England
|
29,017
|
30,647
|
192,000
|
360,000
|
6.62
|
11.75
|
5.13
|
|
Dacorum
|
East England
|
27,754
|
30,674
|
250,000
|
432,000
|
9.01
|
14.08
|
5.07
|
|
Ealing
|
London
|
29,733
|
34,742
|
326,950
|
555,000
|
11.00
|
15.97
|
4.97
|
|
Sevenoaks
|
South East England
|
28,876
|
30,849
|
285,000
|
480,000
|
10.60
|
15.56
|
4.96
|
|
Wokingham
|
South East England
|
34,899
|
37,192
|
285,000
|
486,000
|
8.17
|
13.07
|
4.90
|
|
Brentwood
|
East England
|
30,434
|
34,804
|
275,000
|
485,000
|
9.04
|
13.94
|
4.90
|
|
Tunbridge Wells
|
South East England
|
28,608
|
31,675
|
250,000
|
435,500
|
8.91
|
13.75
|
4.84
|
|
Waverley
|
South East England
|
26,014
|
30,797
|
340,000
|
550,000
|
13.07
|
17.86
|
4.79
|
|
Windsor and Maidenhead
|
South East England
|
33,749
|
37,253
|
338,000
|
545,000
|
10.02
|
14.63
|
4.61
|
|
St Albans
|
East England
|
25,861
|
33,895
|
360,000
|
626,000
|
13.92
|
18.47
|
4.55
|
|
Lambeth
|
London
|
35,397
|
38,168
|
350,000
|
550,000
|
9.89
|
14.41
|
4.52
|
|
Sutton
|
London
|
30,061
|
35,707
|
250,000
|
457,500
|
8.32
|
12.81
|
4.49
|
|
Lewisham
|
London
|
30,478
|
36,104
|
260,000
|
470,000
|
8.53
|
13.02
|
4.49
|
|
Adur
|
South East England
|
22,361
|
26,875
|
218,000
|
382,000
|
9.75
|
14.21
|
4.46
|
|
Southend-on-Sea
|
East England
|
24,821
|
28,337
|
185,000
|
335,000
|
7.45
|
11.82
|
4.37
|
|
Hastings
|
South East England
|
22,103
|
26,012
|
155,000
|
295,000
|
7.01
|
11.34
|
4.33
|
|
Kingston upon Thames
|
London
|
29,450
|
36,150
|
335,000
|
566,000
|
11.38
|
15.66
|
4.28
|
|
Tonbridge and Malling
|
South East England
|
26,769
|
30,659
|
249,950
|
417,500
|
9.34
|
13.62
|
4.28
|


Join the conversation
Be the first to comment (please use the comment box below)
Please login to comment